Metabolic Health
Insulin Resistance, Diabetes, and Red Light: An Evidence Firewall
ADA diagnostics, DPP effect sizes, and where photobiomodulation sits—experimental adjunct, not standard of care.
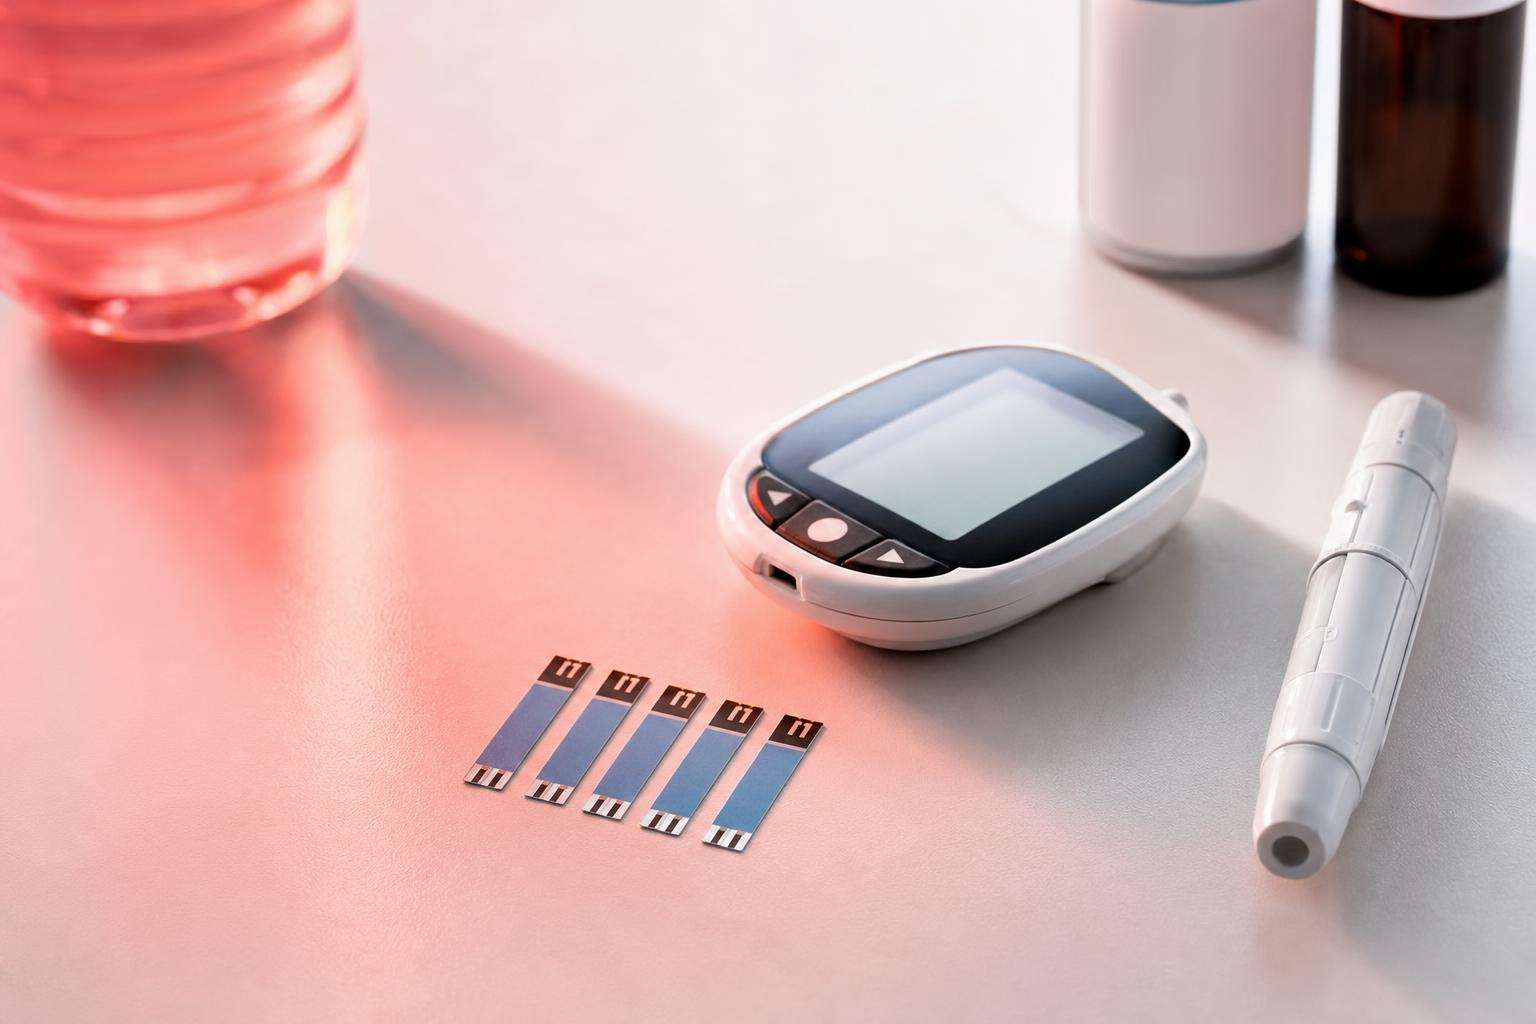
Insulin resistance is diagnosed and managed with ADA-class labs and Grade A lifestyle and medication pathways—not with a glowing panel. Red and near-infrared photobiomodulation has an intriguing acute glucose pilot in healthy adults and preclinical insulin-resistance models, but it remains an experimental adjunct after foundations, never a reason to skip diagnosis or stop glucose-lowering drugs.
Search interest increasingly pairs “insulin resistance” with “red light.” That pairing is only responsible if standard of care comes first, every pilot statistic is context-locked, and sex-specific patterns (visceral fat in men; PCOS, gestational diabetes history, and menopause in women) are tagged. This guide is the metabolic firewall for photobiomodulation hype.
This article is informational and editorial only. It is not medical advice, diagnosis, or a treatment plan. Numbers and literature ranges cited here are not personal prescriptions. Consult a qualified clinician before changing medications, supplements, diet, heat or light exposure, or management of a diagnosed condition. Seek urgent care for emergencies.
What is insulin resistance, and which labs actually matter?
Insulin resistance means target tissues—especially skeletal muscle, liver, and adipose tissue—respond subnormally to insulin. Muscle disposal of glucose via GLUT4 pathways falters; hepatic glucose output stays inappropriately high; adipose lipolysis elevates free fatty acids. Intracellular lipid intermediates (diacylglycerols, ceramides) and inflammatory serine kinases impair insulin-receptor substrate signaling. Compensated resistance features high insulin with still-normal glucose; decompensation yields prediabetes and type 2 diabetes.
American Diabetes Association diagnostic bands remain the clinical backbone: A1C <5.7% normal, 5.7–6.4% prediabetes, ≥6.5% diabetes; fasting plasma glucose <100, 100–125, ≥126 mg/dL; 2-hour 75-gram OGTT <140, 140–199, ≥200 mg/dL. Confirm abnormal results; A1C can mislead with altered red-cell turnover or hemoglobinopathy. Random glucose ≥200 mg/dL with classic symptoms is also diagnostic.
HOMA-IR is a research surrogate: commonly (fasting insulin µU/mL × fasting glucose mg/dL) / 405 in U.S. units. Higher values imply more resistance; analytic cutoffs often sit around ≥2.0–2.5 in some U.S. contexts but are not universal laws across ethnicity, sex, and assay. HOMA is not a stand-alone diabetes diagnosis. Clamp studies remain research gold standards. β-cell failure can falsely lower HOMA despite high glucose.
| Category | A1C | Fasting plasma glucose | 2-h 75-g OGTT |
|---|---|---|---|
| Normal | <5.7% | <100 mg/dL | <140 mg/dL |
| Prediabetes | 5.7–6.4% | 100–125 mg/dL | 140–199 mg/dL |
| Diabetes | ≥6.5% | ≥126 mg/dL | ≥200 mg/dL |
What first-line lifestyle and drug pathways still dominate outcomes?
The Diabetes Prevention Program showed that structured lifestyle aiming for about 7% weight loss plus activity reduced incident type 2 diabetes by about 58% versus placebo—still the load-bearing prevention effect size in public health teaching (NEJM 2002). Metformin reduced risk by about 31% in the same trial. DiRECT-class structured weight management produced diabetes remission near 46% at twelve months in the intervention arm, with probability rising sharply at larger weight-loss categories (including high rates at ≥15 kg).
Exercise prescriptions dual-track aerobic and resistance work: at least 150 minutes per week of moderate-to-vigorous aerobic activity across ≥3 days with no more than two consecutive inactive days, plus resistance training ≥2 days weekly for major muscle groups. Acute exercise increases glucose uptake; chronic training expands capacity. Multi-night sleep restriction near five hours impairs insulin sensitivity in experimental human work; obstructive sleep apnea and shift work amplify risk. Sleep is pillar-equal with diet and training in an honest stack.
Pharmacotherapy is concurrent with lifestyle when indicated—not a moral failure. Metformin remains foundational for many; GLP-1 and dual agonists deliver glucose and weight effects with agent-specific cardiovascular outcome data; SGLT2 inhibitors carry heart-failure and kidney protection signals; thiazolidinediones are true sensitizers with edema, heart-failure, and fracture cautions; insulin and secretagogues bring potency with hypoglycemia and weight tradeoffs. ADA Standards of Care govern person-centered sequencing. Gadget claims must never outrank these effect sizes.
What does red light research actually show for glucose and insulin resistance?
Mechanistically, photobiomodulation is hypothesized to act via cytochrome c oxidase and downstream mitochondrial and signaling effects that could increase peripheral glucose use; biphasic dose response still applies. Preclinical diabetic and high-fat-diet models (Grade C) report improved metabolic programs. Human evidence for systemic glycemia is early.
The index human pilot is Powner and Jeffery, Journal of Biophotonics 2024: 670 nm, fifteen minutes, large upper-back exposure in healthy volunteers (about n=30 class reporting), with a 27.7% reduction in the degree of blood-glucose elevation integrated over two hours after an oral glucose challenge and roughly 7.5% lower maximum spiking. Context locks are mandatory: healthy ≠ type 2 diabetes; acute ≠ chronic HbA1c; pilot ≠ standard of care. Reviews in 2024 map potential and immaturity; multi-center sham-controlled trials with registered HbA1c or clamp primaries, full dosimetry, months of follow-up, and sex stratification are still the upgrade criteria.
Diabetic foot ulcer photobiomodulation is a separate track (Grade B heterogeneous systematic reviews) with local healing endpoints—not proof that light lowers systemic HbA1c. Never launder wound-healing papers into diabetes-cure headlines. Never invent home-panel fluences as trial-equivalent without measurement.
| Step | Intervention class | Evidence for IR/T2D control |
|---|---|---|
| 0 | Diagnose and monitor (ADA labs) | A (standards) |
| 1 | Lifestyle: diet, weight, aerobic + RT, sleep | A |
| 2 | Indicated pharmacotherapy | A (class/agent-specific) |
| 3 | Specialty and complications care | A pathways |
| R | Metabolic PBM research adjunct | B pilot / C preclinical |
How do men’s and women’s insulin-resistance patterns change the story?
Men more often carry visceral android fat at a given BMI and may show higher fasting glucose or insulin resistance at higher adiposity. Hypogonadism and obesity associate bidirectionally; weight loss, sleep apnea care, and resistance training outrank testosterone folklore and red-light “T boost” panels (Grade D). Women face PCOS-related insulin resistance in a large majority of cases (often cited roughly 60–80%, with lean PCOS still substantial), gestational diabetes history with lifelong elevated type 2 risk, and menopause-related central fat and sleep disruption. Red-light PCOS or hormone cure marketing is Grade D. Sex-stratified PBM-IR randomized trials are largely lacking.
Bottom line: diagnose with proper labs; run the Grade A lifestyle and medication ladder; discuss experimental PBM only as optional research-curious adjunct after foundations; dual-source any 27.7% glucose claim with healthy/acute/OGTT context; and never stop diabetes medications for a light panel.
Sources & citations
Frequently asked