Metabolic Health
HOMA-IR Explained: Formula, Cutoffs, and What It Is Not
(Fasting insulin × fasting glucose) / 405 in mg/dL units. Useful IR surrogate—not an ADA diabetes diagnostic criterion.
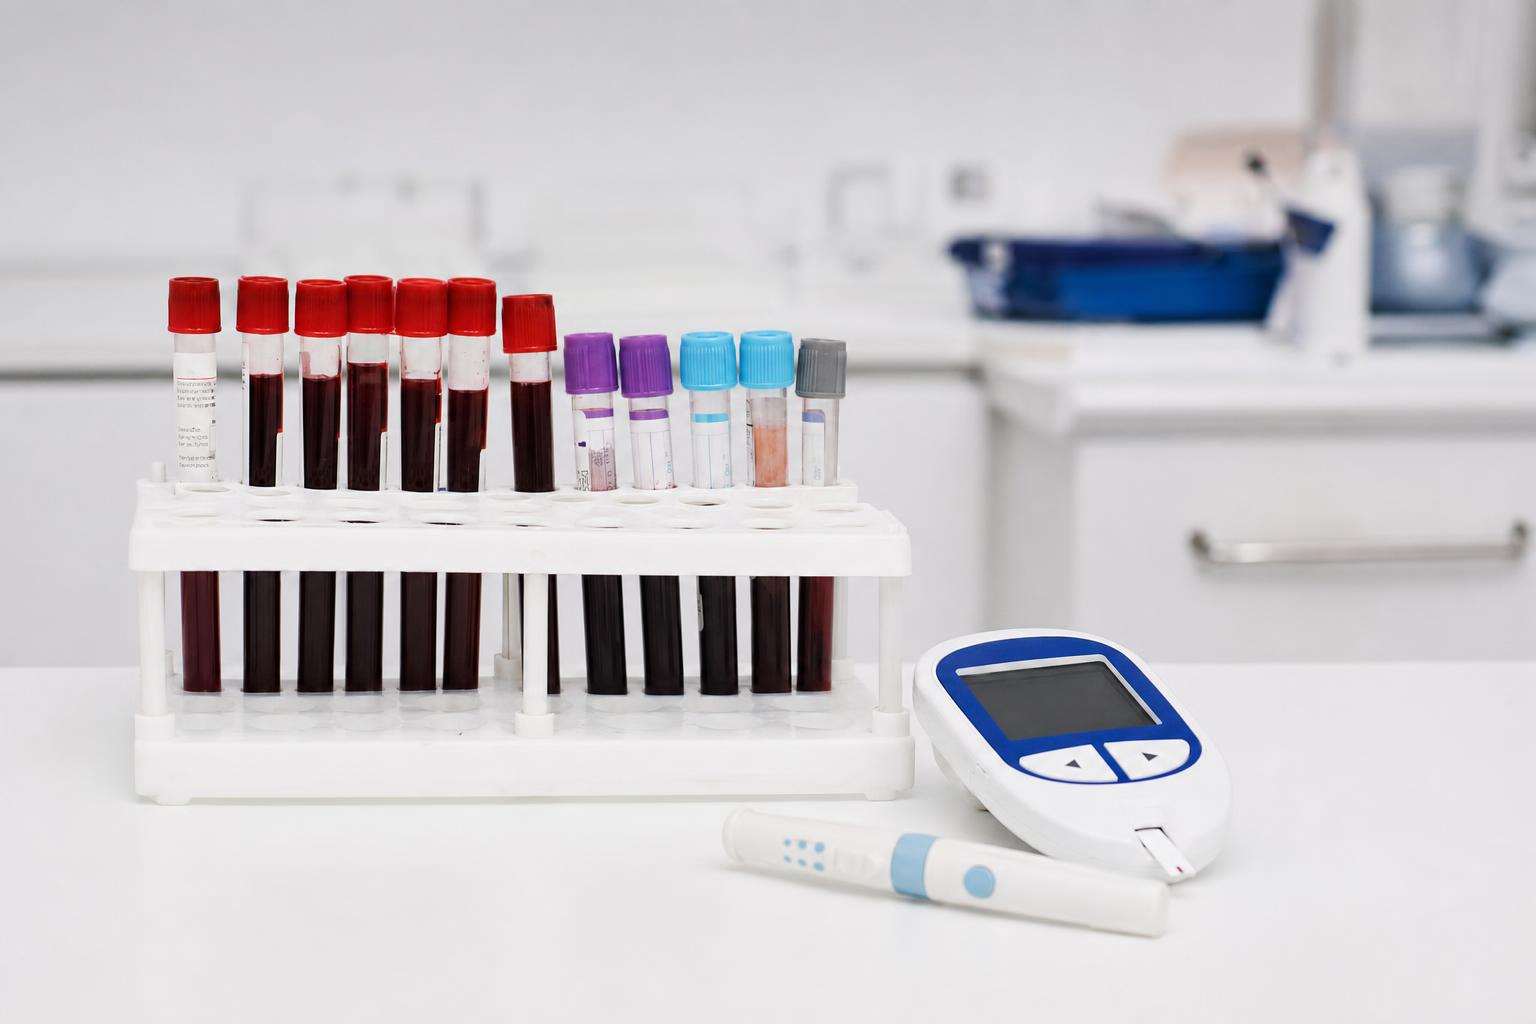
HOMA-IR ≈ (fasting insulin × fasting glucose) / 405 when glucose is mg/dL and insulin µU/mL (÷22.5 if glucose is mmol/L). It estimates insulin resistance—it is not an ADA diabetes diagnostic test. Cutoffs like ≥2.5 are population-analytic, not universal law.
HOMA-IR is everywhere in metabolic Twitter and increasingly on lab printouts. Used well, it is a cheap fasting signal. Used poorly, it becomes a fake diagnosis.
This article is informational and editorial only. It is not medical advice, diagnosis, or a treatment plan. Numbers and literature ranges cited here are not personal prescriptions. Consult a qualified clinician before changing medications, supplements, diet, equipment, or management of a diagnosed condition. Seek urgent care for emergencies.
Where did HOMA-IR come from and how is it calculated?
Matthews and colleagues (1985) described the homeostasis model assessment from fasting glucose–insulin feedback. The practical formulas:
- mg/dL: HOMA-IR = (FPI × FPG) / 405
- mmol/L: HOMA-IR = (FPI × FPG) / 22.5
FPI is fasting plasma insulin (µU/mL); FPG is fasting plasma glucose. Calculators such as MDCalc’s HOMA-IR tool encode the arithmetic; they do not replace clinical judgment. HOMA2 is a computer model update that can estimate IR and beta-cell function with more physiologic assumptions than the simple product.
| Tool | Inputs | Role |
|---|---|---|
| HOMA-IR | Fasting insulin + glucose | Common research/clinical surrogate |
| HOMA2 | Fasting insulin + glucose (model software) | Updated steady-state estimates |
| QUICKI | log fasting insulin + log glucose | Alternative fasting index |
| TyG | Triglycerides + glucose | Metabolic syndrome–linked surrogate |
| Clamp M-value | Insulin infusion + glucose infusion rate | Research gold standard |
| ADA diagnosis | FPG, OGTT, A1c | Diabetes diagnosis—not HOMA |
What cutoffs are used—and why they are not universal?
The original construct orients near HOMA-IR ≈ 1 as normal sensitivity. Analytic practice often flags IR around 2.0–3.0, with ≥2.5 appearing in some U.S. NHANES-linked phenotypes. Other cohorts publish ethnicity- and sex-specific percentile thresholds (sometimes ≥2.6–3.0+). Machine-learning cut-off papers (for example Abdesselam 2021) estimate thresholds inside defined populations—they do not export a global lab normal.
Always state units, assay, and population when quoting a cutoff. Comparing your lab to a different country’s seventy-fifth percentile without context is numerology.
What are the main failure modes?
- Beta-cell failure: high glucose + low insulin → falsely reassuring HOMA.
- Non-fasting draws: invalid steady-state assumption.
- Assay variability: insulin methods and unit conversions differ.
- Medications and acute illness: shift glucose–insulin pairs.
- Category error: treating HOMA as diabetes diagnosis against ADA criteria.
How should clinicians and self-trackers use HOMA productively?
As a screening/research signal and trend under consistent lab methods, alongside waist, triglycerides, HDL, blood pressure, A1c/OGTT when indicated, and lifestyle levers with outcome evidence (weight reduction when appropriate, resistance plus aerobic training, sleep, and guideline-directed medications). Do not sell “optimal HOMA under 1.0 for everyone” as medical standard. Do not ignore post-meal physiology while obsessing over a fasting product.
What should careful readers do with this evidence?
Use primary sources linked in this article before changing household systems, training plans, or clinical conversations. Prefer measurements—lab panels, water tests, training logs, or certified product listings—over marketing claims. When evidence is observational, say so out loud: associations can guide research priorities and low-regret habits without becoming promises of disease prevention. When guidance bodies publish cutoffs or MCLs, treat them as the public reference layer and verify whether your situation is inside that legal or clinical scope. Re-check living agency pages because regulations and practice guidelines update. If two reputable sources disagree, dual-source the claim and prefer the document that states methods, units, and populations clearly. Finally, keep sex, age, pregnancy, and comorbidity modifiers in view whenever the underlying literature is limited to one demographic group.
Health Canon’s editorial standard ranks large controlled trials and codified regulations above single cohorts; cohorts above mechanism speculation; marketing last. The goal of densifying this topic cluster is enough depth that a reader can act without outsourcing judgment to a headline. If you only remember one habit from this page, make it the habit of asking for units, sample, and maintenance or adherence conditions before trusting a number.
What should careful readers do with this evidence?
Use primary sources linked in this article before changing household systems, training plans, or clinical conversations. Prefer measurements—lab panels, water tests, training logs, or certified product listings—over marketing claims. When evidence is observational, say so out loud: associations can guide research priorities and low-regret habits without becoming promises of disease prevention. When guidance bodies publish cutoffs or MCLs, treat them as the public reference layer and verify whether your situation is inside that legal or clinical scope. Re-check living agency pages because regulations and practice guidelines update. If two reputable sources disagree, dual-source the claim and prefer the document that states methods, units, and populations clearly. Finally, keep sex, age, pregnancy, and comorbidity modifiers in view whenever the underlying literature is limited to one demographic group.
Health Canon’s editorial standard ranks large controlled trials and codified regulations above single cohorts; cohorts above mechanism speculation; marketing last. The goal of densifying this topic cluster is enough depth that a reader can act without outsourcing judgment to a headline. If you only remember one habit from this page, make it the habit of asking for units, sample, and maintenance or adherence conditions before trusting a number.
Sources & citations
Frequently asked